The backlog in Veterans Benefits Administration disability application processing continued to shrink in April, with the number of claims pending over 125 days reduced by 23,000 55,000 and the average days pending down by just under two days.
April was the fourth consecutive month of progress after stalls in November and December of 2013.
Chart and table below detail changes month-to-month, week-to-week and year-over-year.
Data is take from the VBA’s weekly “Monday Morning Workload Reports” that track claims processing progress. We think monthly tracking is a better barometer of actual progress because it flattens out some of the temporary ups and downs the weekly reports reflect.
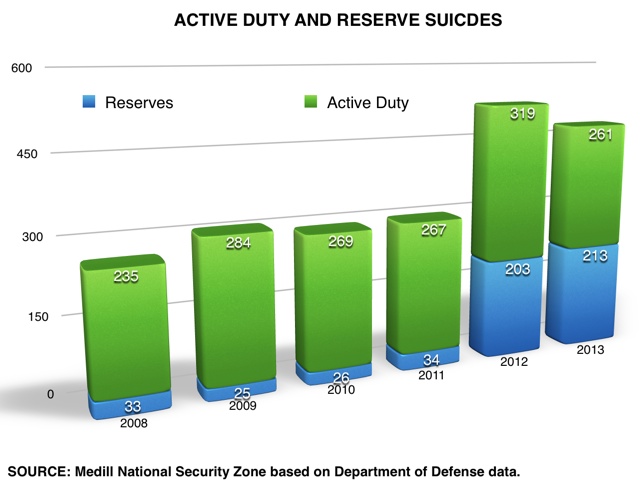
Overall suicides in the U.S. military were down just under 10% in 2013 over the year before, although there was slight increase (5%) among reservists and those not on active duty, new data from the Department of Defense shows.
With the wind-down in Afghanistan well under way, the gap between casualties and suicides grew even more dramatically, now nearly 4-1 vs. just under 2-1 the year before. (See chart below).
The data was part of the extensive annual “Suicide Event Report” that is put together by the National Center for Telehealth & Technology. The latest report covered calendar year 2012, while a news release about the report include top-level data for 2013. (Access a PDF of that report and earlier years back to 2008 here).
The U.S. Army halted what had been monthly updates of its suicide data after November data was posted in December. Reports suggest the Army is changing its methodology and will move to a quarterly instead of monthly release.
The Marines and Navy have, and continue to, release data each month, often updating the earlier month’s data. In 2013, Navy and Marine suicides fell, while attempted suicides by Marines jumped, based on the monthly data release.
For the Army in 2013, total suicides were on the decline but the percentage that were reservists had increased as a percentage of all suicides, from 40% to 50%. That data does not include December statistics, which have yet to be released.
Veterans Benefits Administration workers put a dent in the backlog of veterans disability claims in March, processing 32,000 claims and cutting the percentage pending more than 125 days by nearly two percentage points. March was the third consecutive month of progress after stalls in November and December of 2013.
Chart and table below detail changes month-to-month, week-to-week and year-over-year.
Data is take from the VBA’s weekly “Monday Morning Workload Reports” that track claims processing progress. We think monthly tracking is a better barometer of actual progress because it flattens out some of the temporary ups and downs the weekly reports reflect.
U.S. law enforcement requests for data about Google users set a new record, data that Google released about the second half of the year yesterday showed.
Wielding subpoenas in 2 out of 3 cases, agencies asked 21,500 times — 59 times a day — for information about nearly 40,000 users and/or accounts. Unlike court orders and warrants, subpoenas are not necessarily issued by a court.
The number of requests was down slightly in the second half of the year (3%) and the number of users/accounts was down a bit more (16%). It is unclear whether the enormous publicity over monitoring of personal data after Edward Snowden released a plethora of explosive NSA documents in the Spring may have been a factor in the slight decline. The drop in the second half of 2013 as the first ever reported on a half-year basis since Google started releasing the data after the second half of 2009.
The data released on Thursday focused on requests that are unrelated to national security, i.e., involving the National Security Agency, FBI and secret Foreign Intelligence Surveillance Court. Aggregate data about those cases was released in February after the Obama administration slightly reduced restrictions on public release.
Google has been releasing the so-called “Transparency Reports” since 2009; some of its peers and competitors didn’t follow suit until the last year. The requests from law enforcement in some cases cover just information about an account holder or user, such as address; in other cases, authorities ask for actual content produced by the user (e.g., Gmail, YouTube, etc.). In 2013, at least some data was released in just over 4 in 5 cases.
The U.S. by far remained the leader in requests, accounting for 43% of all requests (up slightly over the first half), distantly followed by France, Germany and India in the second half of the year. The number of countries that made requests was up in the second half of the year, but about half were for 20 or fewer.
Requests by year and number of accounts affected
Broken down by first and second halves of years
Types of orders
For good measure, Google released this animated cartoon about how it deals with warrants.
Just under 1 in 10 of the 2.8 million U.S. veterans who have served since 9/11 remained out of work last year, with a 9% unemployment rate that was effectively the same as 2012 although it was numerically a little less. (Release, with links to detailed tables).
The Bureau of Labor Statistics in its Thursday release about the data cautioned that the new rates for male (8.8%) and female (9.6%) so-called “Gulf War II era” veterans “were not statistically different” from 2012. A year ago, the overall rate was 9.9%.
The overall 9% rate for Gulf War II veterans is just over one-third higher than the 6.6% for veterans as whole and one-fourth higher than non-veterans.
National Security Zone and On the Beat have aggregated veteran’s unemployment data back to 2006. That data is available for your use via this spreadsheet.
The new report also reported that twice as many of those most-recent recent veterans have service connected disabilities than all veterans — 29% vs. 15% as of August.
Gulf War II era veterans also reported more significant disability than other cohorts. Of those reporting a disability, 57% of Gulf War II veterans said they were 30% or more disabled compared to 47% for all veterans.
Of the Gulf War II veterans, about 40% reported having served in Afghanistan, Iraq or both. Those who served in both theaters had a slightly higher unemployment rate (13.3%) than those in only Iraq (10) and Afghanistan (12.3). The rate for those who served elsewhere: 10.9%.
Hispanic and Asian veterans from the most recent era had higher than average unemployment rates — 10.3% and 9.7% compared to 9% for White or African American.
The data was based on the monthly reports the bureau does through the Census Bureau’s Current Population Survey of 60,000 households. It was supplemented by a special addition to the CPS in August that sought additional information about veterans.
Gulf War I: Aug. 1990-Aug. 2001. Gulf War II: Sept. 2001 to present.
National Security Zone chart from Bureau of Labor Statistics data.
States with the highest, lowest veteran’s 2013 unemployment rates
Starting today, we are switching to monthly instead of weekly snapshots of veterans disability claims status, based on data from the Veterans Benefits Administration’s weekly “Monday Morning Workload Reports” that track claims processing progress. We think monthly tracking is a better barometer of actual progress because it flattens out some of the temporary ups and downs the weekly reports reflect.
Below is our weekly snapshot of veterans disability claims status, based on data from the Veterans Benefits Administration’s weekly “Monday Morning Workload Reports” that track claims processing progress.