Tag Archives: data

New studies released on military suicides and sexual assault at military academies


By SB Anderson

Two studies released in recent days interest to national security reporters:

  • Suicide by male veterans aged 18-29 is up dramatically, the VA said in an update of its 2012 report on suicide among veterans. The rate for those seeking care from the VA rose from 40 per 1,000 in 2009 to 58% in 2011, the most recent year for which data is available.

    “This is awful and alarming news,” Paul Rieckhoff, the head of Iraq and Afghanistan Veterans of America said.

    Overall, the number of veterans taking their own lives has remained steady, at about 22 per day.

    Update on the 2012 VA Suicide Report  | Original 2012 report | LA Times story | VA release

va-young-suicides

SOURCE: VA report.

  • Reports of sexual  assaults at the three major U.S. military academies was down about 10% last year, dropping from 80 to 70, a new VA report said. About two in three of the assaults were at the Air Force Academy.Alcohol remains “a significant factor” in the assaults. “Of the 34 investigations of Unrestricted Reports completed during APY 12-13, 11 (32%) involved the use of alcohol by one or more parties,” the report said.  (Unrestricted reports are those made to command or law enforcement vs. restricted reports, in which the victim receives confidential care but there is no investigation).

    The latest report. | Other reports and releases available at DOD’s main sexual assault site.  | AP story | Related: Sexual assault charges dropped at Annapolis

Weekly VA disability claims snapshot: Backslide continues


By SB Anderson

The Veterans Benefits Administration posted its second week in a row of growth in backlogged disability claims, saying in its weekly progress report that claims older than 125 days grew by nearly 11,000 last week.

What had been smooth progress against the huge backlog that began in mid-summer 2013 reversed in November and for the rest of the year see-sawed between the positive and negative, based on the weekly “Monday Morning Work Workload Reports.

Despite some backsliding since Thanksgiving, there was overall substantial improvement in the past year, with about 23% fewer claims pending overall and more than a third fewer waiting over 125 days. The percentage taking over 125 days had been cut by 11 percentage points.


Weekly progress since mid-summer

Below is our weekly snapshot of claims status and two graphics from the Veterans Benefits Administration’s weekly “Monday Morning Workload Reports” that track claims processing progress.


  CLAIMS PENDING OVER 125 DAYS % OVER 125 DAYS AVG. DAYS PENDING
This week 636,274 388,178 61.00% 175.7
Last week 636,029 377,409 59.30% 173.8
Change 245 10,769 1.70% 1.9
Year ago 823,140 574,838 69.80% N/A

View earlier weekly summaries.

Airport gun confiscations soared 20% in 2013


By SB Anderson

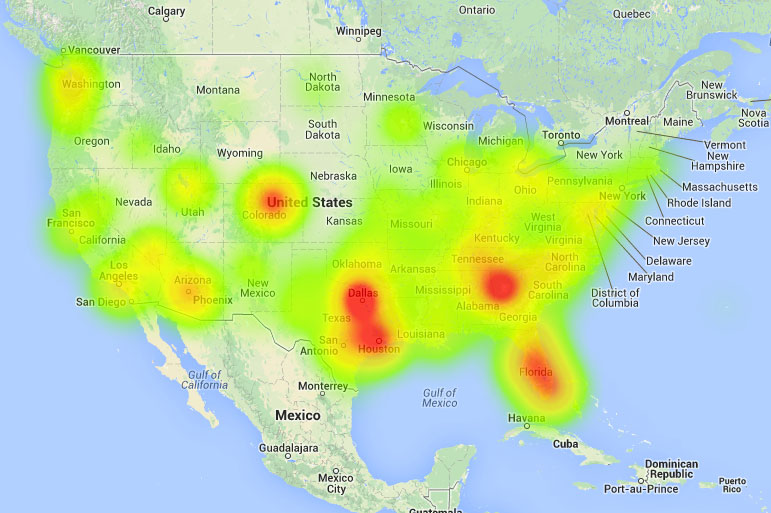
The number of guns confiscated from passengers trying to board planes in the U.S. jumped 20% in 2013 to 1,828, with the Atlanta airport leading the way at 110 confiscations. Five guns were seized on the average day across the nation’s airports.

The vast majority of guns — 84% — were loaded when Transportation Security Administration agents discovered them during security screenings, and of those loaded, one in three had a bullet in the chamber, ready to fire.

The increase over 2012 is the third annual jump since 2010 — and the largest.

Data used in this story was gathered and analyzed by Medill National Security Journalism Initiative from weekly data releases the TSA makes on its blog. A TSA official said Friday that final figures will be released shortly. Final numbers tend to be slightly higher than those compiled by Medill because the weekly blog post data is not updated after it is posted.

Read the full story

Below is a heat map that illuminates location of airports where the most guns were found. Intensity in this heat map runs from lowest (light green) to highest (dark red) based on the number of guns confiscated.

2013 gun confiscations heat map

Weekly VA disability claims snapshot: Backslide is back, but backlog for year down a third


By SB Anderson

For the third time since mid-summer, progress last week ground to a halt — and backslid a bit — against the number of outstanding Veterans Benefits Administration disability claims.

The average number of days claims were pending crept up by nearly 3 days, weekly data released on Monday showed, and the percentage waiting over 125 days ticked up a point to 59.3%.

The step backward follows two positive weeks in processing, which followed the first two weeks of backsliding since early summer. What had been steady progress against the backlog due to Congressional pressure had already been slowing in November — even after maintaining a positive clip during the October government shutdown — but a net gain of 2,332 backlogged claims older than 125 days two weeks ago was a reversal.

Despite a few hiccups since Thanksgiving, there has been substantial improvement in the past year, with about 23% fewer claims pending overall and more than a third fewer waiting over 125 days. The percentage taking over 124 days has been cut by 11 percentage points.

The U.S. Senate Veteran’s Affairs Committee met earlier this month for an update on the Veterans Benefits Administration progress in reducing the backlog and heard officials pledge to continue chipping away at the backlog.

End of 2013 v. 2012

  CLAIMS PENDING PENDING OVER 125 DAYS % OVER 125 DAYS
End of 2013 636,029 377,409 59.30%
End of 2012 823,140 574,838 69.80%
Change -187,111 -197,429 -10.50%
Pct. Change -23% -34%  


Weekly progress since mid-summer

Below is our weekly snapshot of claims status and two graphics from the Veterans Benefits Administration’s weekly “Monday Morning Workload Reports” that track claims processing progress.

  CLAIMS PENDING OVER 125 DAYS % OVER 125 DAYS AVG. DAYS PENDING
This week 636,029 377,409 59.30% 173.8
Last week 635,983 371,045 58.30% 171.2
Change 46 6,364 1.00% 2.6
Year ago 823,140 574,838 69.80% N/A

View earlier weekly summaries.

VA disability claims processing snaps backslide


By SB Anderson

A two-week backslide in processing veterans disability claims has ended, with the number of outstanding claims taking longer than 125 days to resolve shrinking by 4,300 last week. The average number of days pending slipped a bit to 171.6 from 172.9.

The previous two weeks were the first increases in the backlog since early summer and raised the hackles of veterans advocates. One advocacy group blamed the backsliding on elimination of mandatory overtime that had been authorized.

What had been steady progress against the backlog due to Congressional pressure had been slowing in November — even after maintaining a positive clip during the October government shutdown — but a net gain of 2,332 backlogged claims older than 125 days two weeks ago was a reversal.

The U.S. Senate Veteran’s Affairs Committee met last week for an update on the Veterans Benefits Administration progress in reducing the backlog and heard officials pledge to continue chipping away at the backlog.

Below is our weekly snapshot of claims status and two graphics from the Veterans Benefits Administration’s weekly “Monday Morning Workload Reports” that track claims processing progress.

  CLAIMS PENDING OVER 125 DAYS % OVER 125 DAYS AVG. DAYS PENDING
This week 639,388 374,073 58.50% 171.6
Last week 642,861 378,349 58.90% 172.9
Change -3,473 -4,276 0 -1
Year ago 824,601 567,748 68.90% N/A

Below: Claims pending (left) and backlog (right) by era served, as of 12/14/13. (Note: Includes disability and pension claims, so total numbers are different than above). Pie charts are from the Veteran’s Benefits Administration.

12-16-13-report-claims-pending
View earlier weekly summaries.

VA disability backlog grows for second week row


By SB Anderson

Veterans disability claims that have taken longer than 125 days to process have increased for the second week in a row, growing by 3,345 claims compared to the week before.

The previous week was the first increase in the backlog since early summer and raised the hackles of veterans advocated. One advocacy group blamed the backsliding on elimination of mandatory overtime that had been authorized.

What had been steady progress against the backlog due to Congressional pressure had been slowing in recent weeks — even after maintaining a positive clip during the October government shutdown — but the net gain of 2,332 backlogged claims older than 125 days last week was a reversal.

The U.S. Senate Veteran’s Affairs Committee is meeting this morning (Dec. 11) for an update on the Veterans Benefits Administration progress in reducing the backlog.

Below is our weekly snapshot of claims status and two graphics from the Veterans Benefits Administration’s weekly “Monday Morning Workload Reports” that track claims processing progress.

  CLAIMS PENDING OVER 125 DAYS % OVER 125 DAYS AVG. DAYS PENDING
This week 642,861 378,349 58.90% 172.9
Last week 641,894 375,004 58.40% 173.4
Change 967 3,345 0 -1
Year ago 824,601 567,748 68.90% N/A

Below: Claims pending (left) and backlog (right) by era served, as of 12/2/13. (Note: Includes disability and pension claims, so total numbers are different than above). Pie charts are from the Veteran’s Benefits Administration.

12/9/2013 VA disability claims status
View earlier weekly summaries.

TSA spare change


By SB Anderson

As Congress debates how to best reallocate the $500,000 a year in loose change that the Transportation Security Administration banks from people who forget to pick theirs up after finishing security screening, we thought it would be a good time to list how much was collected at each airport during 2012, the last year for which data is collected.

Las Vegas at No. 2 is something of a surprise; you’d think travelers would be more attentive in keeping their last few coins to use in the hundreds of slot machines at the gates. The leanest haul? Guam’s airport, with a total of $1.70.

The chart below shows the amount of change collected by city, sorted from the most to the least. Click the arrow or numbers at bottom to see the next 10 airports. You can also sort by clicking on the field names.

Data was extracted from a TSA report originally posted by the Wall Street Journal.

We’ve posted the the full spreadsheet here for you to download.