WASHINGTON – Twenty-four hours after a magnitude 7.8-earthquake struck Nepal on April 25th at 11:56 a.m. NST, a disaster-response team at the National Aeronautics and Space Administration started making conference calls to colleagues around the world to coordinate their activities.
The team, which grew in a few days from 20 people to several hundred, quickly established data storage and sharing centers and communication channels to analyze the emergency and press for more information from their partner networks.
“Every individual working on earthquakes, glaciers in the Himalayas, floods, landslides, imagery, capacity building, infrastructure, communication, media was contacted, and a firm response structure was established,” said Dr. David Green, the program manager for disaster applications in NASA’s Earth Science Division. Before joining NASA’s Applied Sciences program last September, Green spent a decade at NOAA, the National Oceanic and Atmospheric Administration.
Senior NASA executives were briefed around the clock, and collaborated with the leadership of NOAA and other U.S. agencies, as well as international partner agencies such as the World Bank, the American Red Cross and the United Nations Children’s Fund, or UNICEF.
From the space to the ground
The Disaster Program is one of the nine applications areas under the Applied Sciences program in NASA’s Earth Science Division, and has the primary task of responding to the Nepal disaster.
The Gorkga earthquake, as it is known, has killed more than 8,800 people, injured more than 23,000, and together with subsequent aftershocks, caused damage worth $5 billion to physical infrastructure and assets, according to the Nepal government. Humanitarian rescue organizations, including UNICEF, engaged in the response and relief right after it occurred, with the help of NASA’s data products – mostly mapping information, imagery and other data gathered by U.S. satellites.
NASA, for instance, has produced a series of “damage proxy maps” that allow rescue workers and other responders to find out where the damage – and injuries and deaths – are the greatest.
“They are very useful indeed to enable a better response by the government and the development partners,” Amjad Rabi, the chief of Social Policy and Economic Analysis Section at UNICEF, said in an email.
Among a variety of products developed by NASA and its partners, the “damage proxy maps” are used to determine the type and extent of existing damage. However, it was not until the disaster took place did the two agencies start to get connected.
According to Rabi, prior to the earthquake, UNICEF had invited a team of scientists from NASA’s California-based Jet Propulsion Laboratory and other partners on a fact-finding mission. During this mission, the scientists interacted with key stakeholders in the field of disaster risk assessment and analysis, including the government agencies, donors and research organizations. A mission report outlined possible products and tools, in which satellite data can be developed to better prepare Nepal in case of emergency.
“The earthquake of April 25, 2015 accelerated this program,” Rabi said. “We consider our engagement with NASA and other scientific groups as an investment and a much needed infrastructure work that will allow us to be better prepared. It is a long-term engagement that will progressively benefit us more and more in many ways.”
The data products provided by NASA came not only from its own satellites such as Terra, which was launched 15 years ago as the first satellite to look at earth system science; but also from NASA’s international network, including the International Charter of Major Disasters and Committee on Earth Observation Satellites. All of that data is free and open.
Too much to be utilized
The Disaster Program, formerly called the Natural Disaster Program, was initiated more than 5 years ago with the whole Applied Sciences project. According to its 2012 budget, the entire project will get a funding of $39.2 million for 2015, while funding for the Disaster Program is around $3 million. And, Green said, “We expect growth.” As no additional resources are allocated, the program will have to leverage its existing activities, partnerships and projects.
However, that doesn’t mean a constraint of NASA’s ability to respond to the emergencies. Quite the opposite, Green expressed concerns for the use of all information that satellites collected above the sky.
“The greatest challenge is we have so much to offer as a science agency that we want to make sure the data and research products are applied and utilized.”
Rabi agreed with the idea, saying the tremendous amounts of data and imagery available has led to an overload of information provided to response agencies and decision makers.
In order to effectively use this information, Rabi said, UNICEF’s Nepal Country office worked closely with NASA scientists and other agencies to filter out all but the most useful information, so that rescue teams can get what they need easily and quickly.
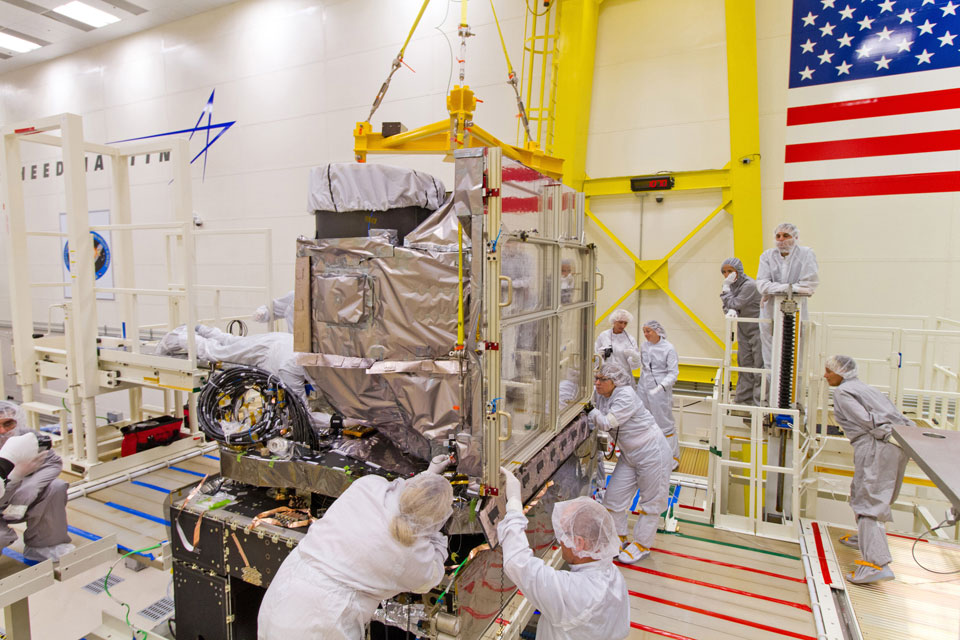
New satellite to transform environmental tracking, but at what cost?
(NOAA Photo)
WASHINGTON – For 40 years, the United States has sent Geostationary Operational Environmental Satellites (GOES) into orbit, where they are producing images every 15 minutes in geosynchronous orbit, approximately 22,300 miles above Earth. They provide cloud, land, and ocean temperatures; monitor activities of the sun; and relay emergency locator beacon signals to assist with search and rescue activities.
The GOES R-Series, which is the next generation of GOES satellite, is scheduled to launch in March 2016. The joint project by NASA and the National Oceanographic and Atmospheric Administration (NOAA), has not been without at least some delays and problems, which have been caused by both contracting and technical issues.
But GOES-R will offer a number of significant improvements in geostationary environmental data provided to the National Weather Service and the broader weather forecasting community.
This means users can get much higher resolution pictures of the clouds with faster update speed. The National Hurricane Center (NHC) and the Storm Prediction Center (SPC) can take advantage of it to forecast extreme weather more timely and accurately.
Major instruments on the GOES-R series of satellites will be:
Advanced Baseline Imager. ABI is a huge leap forward over the current imager’s capabilities, which may bring $4.6 billion in lifetime operational benefit to The tracking of developing storms will be more accurate and the warning will be more timely and precise. ABI will allow more and better derived upper level wind observation to inform improved accuracy in global numerical models, however, it could be a challenge to fully exploit the capabilities of ABI in the early stage of the mission.
Space Environment In-Situ Suite. SEISS provides critical information to assess electrostatic discharge risk and radiation hazard. They affect the communications system and cause other malfunctions to the satellite and astronauts.
Solar Ultra Violet Imager. SUVI is an evolutionary improvement to the existing Solar X-Ray Imager (SXI) on the N/O/P series satellites. It allows NOAA’s Space Weather Prediction Center (SPC) to have an improved capability of solar storm monitoring and space weather predictions and warnings.
Extreme Ultraviolet and X-Ray Irradiance Sensors. EXIS will be able to detect solar flares that could interrupt communications, reduce navigational accuracy and affect aerial activities. It is critical to monitoring solar radiant energy in the upper atmosphere. The power and telecom companies can take advantage of it to protect their operations.
Geostationary Lightning Mapper. GLM will be the first-ever operational lightning mapper flown from geostationary orbit. It has major capability of predicting thunderstorms, warning lightning ground strikes, and potentially improves tornado warning lead time of up to 21 minutes. It is also expected to provide improved routing of commercial, military, and private aircraft over limited oceanic regions where observation of thunderstorm intensity are scarce.
One of the biggest challenges at the beginning of the project was contract management. The risk and increasing cost have long been a concern due to the slow progress in the early contracting phase and development delays, according to one private contractor who spoke on the condition of anonymity because he was formerly involved in the project.
In 2013, the Commerce Department’s Office of Inspector General issued a report that found NOAA had delayed finalizing negotiations for almost a year to two years on its six significant changes to the core ground system contract.
Because of these delays, the government lost the opportunity to negotiate costs on an estimated $79.6 million, according to the watchdog agency of the Commerce Department, which oversees NOAA. In 2013, the ABI, GLM, and the spacecraft overran their contracts by $264 million, $86 million and $11 million respectively, resulting from contractors’ underestimating the effort and technical complexity of the instruments, immature designs, and difficulty managing subcontractors’ cost increases and schedule slips, according to OIG reports.
The latest OIG report also points out that the revised launch schedule will still pose a challenge for the program to meet, due to past schedule performance and a complex integration and test process. Those delays could leave the GOES-R on-orbit constellation without a backup satellite for 29 months out of a 33-month period from April 2015 to January 2018.
However, the former project source said, delays in the early stage may not be a bad thing because they are designed to help avoid significant problems that plagued past satellite projects.
“Thankfully separate contracts for the instruments, spacecraft, and ground system as opposed to the discredited NPOESS (The National Polar-orbiting Operational Environmental Satellite System) one-contract-for-all failed approach,” according to the former contractor. He said this single-source mode of contract, combined with the absence of oversight by the Goddard contract office, caused soaring costs, delays and other problems that ultimately result in the implosion of the NPOESS contract.
“It was a disaster until NOAA finally pulled the plug on it,” said the source.
Going forward, the agency wanted to avoid a reoccurrence. “The decision was finally made to return to the traditional procurement methods for GOES-R,’’ said the source. “Thank God.”
Given the nature of complicated satellite contracts, GOES-R is not perfect.
According to the latest OIG report, the lack of experienced engineers for key positions in the early stage contributed to schedule delays and core ground system contract cost increase. NOAA replies that they “will continue to review the effectiveness of efforts to ensure staffing for the GOES-R and other programs are properly allocated to meet the mission.”
The measures taken to mitigate the risk and cost, and to prevent further delay, is basically to sacrifice part of the functionality of the whole system. In 2006, NOAA decided to reduce the scope and technical complexity of the GOES-R program for the expectation of huge cost raise.
For example, the Hyperspectral Environmental Suite (HES) was selected to remove from the baseline program because its main function – atmospheric sounding – is not the core requirement for the mission which is improving weather forecasts and warnings. Indeed, HES would have new capabilities in coastal ocean imaging, but data can be obtained via other ocean satellites.
The scope of the GOES-R Series Program was established in 2007 and has met all the requirements. “The program has been providing sample data to users through our Proving Ground project in preparation for the new capabilities for a number of years, and the users are very excited about the new capabilities available once GOES-R becomes operational,” said Leslie.
This May, Harris Corporation, the prime contractor of the ground segment, has successfully completed the final two tests. The ground system is now ready for use after nearly 500 defects were removed since 2014. In addition, the GOES-R ground segment architecture now has a more flexible design after a recommendation by OIG. It will support additional requirements in the future.
On June 3, Lockheed Martin, the prime contractor of the flight segment has completed assembly the satellite. It is now undergoing extreme weather condition testing about what the satellite might experience in space.
Once launched, the GOES-R satellite will be placed into an orbit where the spacecraft and instruments will go through post-launch checkout for approximately six months followed by an extended product validation phase with observational data provided through the 2016 Atlantic Hurricane Season, according to Leslie.
Once that process is complete, the data will be accessed by forecasters in the public and private sectors for monitoring hurricane tracks and winds in the Atlantic, and severe storms in the Midwest, said Nancy Colleton, President of Institute for Global Environmental Strategies. The data will eventually be integrated into storm scale forecast models that will significantly reduce the time need to identify weather conditions.
However, Colleton said that it can be big challenge for the community to sift through the great amount of data – approximately 3.5 terabytes per day – to fully exploit the satellite’s capability. The decision on where to place the satellite will be made after analysis of the data from the GOES-R instruments and an assessment of the performance of the existing GOES satellites and in consultation with the needs of the National Weather Service.
“GOES-R will be game changing. There is incredible enthusiasm in the community for what this satellite will deliver and how forecasts will be improved,” Colleton said.
WASHINGTON — New advances in satellite mapping data could soon help analyze and fight droughts in California and the Southwestern U.S. by tracking the amount of water locked in soil. But problems in the design of the NASA program have caused temporary delays.
NASA’s SMAP mission, short for Soil Moisture Active Passive, began its formal data collection operation in May. That’s two months later than what was initially projected, according to a report by the Government Accountability Office.
The delay of launch date, from November 2014 to January 2015, was caused by technical issues the science team identified in September of last year. “But the technical issues didn’t require up to three months to address. We probably needed about a month and half, so we could be ready in November,” said Simon Yueh, SMAP’s project scientist at NASA’s Jet Propulsion Laboratory, which is managed by the California Institute of Technology for Earth-orbit and astronomy missions. Yueh said they waited for another two months for the availability of the Vandenberg Air Force Base.
The SMAP observatory carries two instruments — a radar (active) and a radiometer (passive) — that will map soil moisture and determine whether the area being mapped is frozen or thawed. Both the radar and radiometer share a common antenna and external “feed assembly.”
The technical issues that caused the delay in launch date occurred during the mission’s test period. According to the GAO report, the reflector boom assembly experienced anomalies that caused its mesh antenna to not open or “bloom” correctly.
“The way NASA designed and tested the mission, before we launch the rocket into the space, is that the risk had to reach a level that’s low enough,” said Yueh. “So we did additional testing.” Yueh said the science team resolved the technical problems and reviewed the whole mission with NASA before launch.
Despite the delay of launch date, the overall life cycle cost of the project had a slight decrease from $916.4 million to $914.5 million. NASA requested $61.1 million more for SMAP in FY2013 than it had in the previous fiscal year. But according to statistics provided by the GAO and by Shelby Oakley, who has been watching the SMAP mission since 2009, the requested amount of money was previously set aside in the project’s cost reserves and was ultimately used to meet the higher operation cost caused by delay of launch date. Meanwhile, a decrease in development cost allows SMAP to run within its initial life cycle costs.
“NASA does follow established Program Management practices associated with cost control and accountability,” said project participant Steve Cole of NASA. “To date nothing has been identified that would cause the prime mission costs to increase about what is in the current budget request.”
As of May 19, SMAP has gone through its commissioning phase — the first three months in orbit to ensure data reliability. During this period, SMAP has provided images of soil freeze/thaw status with 1.9-mile (3-kilometer) resolution for land areas north of 45 degrees North latitude, allowing scientists to capture the progression of spring snow melt northward across Alaska, the boreal forests of northern Canada and large areas of Russia.
SMAP shows progression of spring thaw in the Northern Hemisphere. Image credit: NASA/JPL-Caltech
Although the resolution isn’t as sharp as scientists had hoped, “This is a vast improvement over any prior attempt,” said Todd Caldwell, a water scientist at University of Texas at Austin. “As the data becomes more operational in climatology, agronomy and hydrology, there will be even more push to improve the spatial and temporal resolution of the next generation of soil moisture satellites.”
The satellite data will be used at first to help farmers contend with record drought conditions that have caused billions in damages.
SMAP helps measure the Earth’s moisture in the top two inches (five centimeters) of topsoil every two to three days. This mapping data is crucial for drought-stricken areas because of the satellite’s ability to track the amount of water locked in soil.
“When we grow the crops, the crops depend on how much water are available in the soil, so the farmers can know how much additional water they need to use for irrigation, ” said Simon Yueh. “So soil moisture can provide information about where to grow the crops and also for water management.”
The new technology could help locals like Robert LoBue, the owner of an 81-year-old citrus farm of 1000 acres in Lindsay, California. Now, because of the drought, he
has to water the trees by smaller blocks to conserve water. The orange and lemon trees produce less fruit because of the drought, and it costs more to cultivate them.
LoBue is one of those farmers who are not yet convinced about SMAP’s usefulness. He relies mostly on instinct and experience. For information about soil conditions, instead of referring to satellite mapping data directly, he has consultants come and take samples.
Todd Caldwell said the soil moisture data will be even more helpful for state and county level crop forecasts. But, he said, “It may take some time for policy and decision makers to adapt to it.”
John J. Lacey-King, of California Department of Water Resources, said satellite mapping data is not yet a source of their water analysis. “We may get there, but we are still learning how to use it,” he said. “From a cost perspective, satellite imagery may not be as accurate as the airplane imagery, but it’s more cost-effective, so satellite imagery looks more promising than air plane imagery.”
The SMAP data can help in a number of other ways as well.
Those include weather forecasts, flooding monitoring and other water-related problems. “The flooding can be contributed by many factors added altogether. One is precipitation, and another is the condition of the ground,” said Yueh. “If the soil is already saturated, then the additional rainfall becomes what we call the runoff because they have nowhere to go, then all of a sudden all the water just go into the river channel.” In that sense, the SMAP data helps forecasting potential flooding and reducing damages.
The images show the volumetric water content in the top 2 inches (5 centimeters) of soil. Wetter areas are blue and drier areas are yellow. White areas indicate snow, ice or frozen ground. (Image credit: NASA/JPL-Caltech/GSFC)
And in terms of weather forecast, Yueh said tracking water in the soil helps in predicting both precipitation and temperature. After water evaporates from the soil and rises to form clouds, the clouds may turn into rain; meanwhile, the heat is dissipated through the process of evaporation, which helps maintain the temperature of the ground. “So soil moisture data can provide people at NOAA’s National Weather Service with quality input into what we call the weather model,“ he said. “And they can make weather forecasts within a short range of time.”
According to NASA, SMAP data processing will be conducted by JPL at its lab in Pasadena, California, and at the agency’s Goddard Space Flight Center in Greenbelt, Maryland. Preliminary calibrated data for public will be available in August, 2015 at designated public-access data archives, including the National Snow and Ice Data Center in Boulder, Colorado, and Alaska Satellite Facility in Fairbanks. Preliminary data about whether the soil is frozen or thawed will be available in November, with validated measurements scheduled to be available for use by the general science community in the summer of 2016.
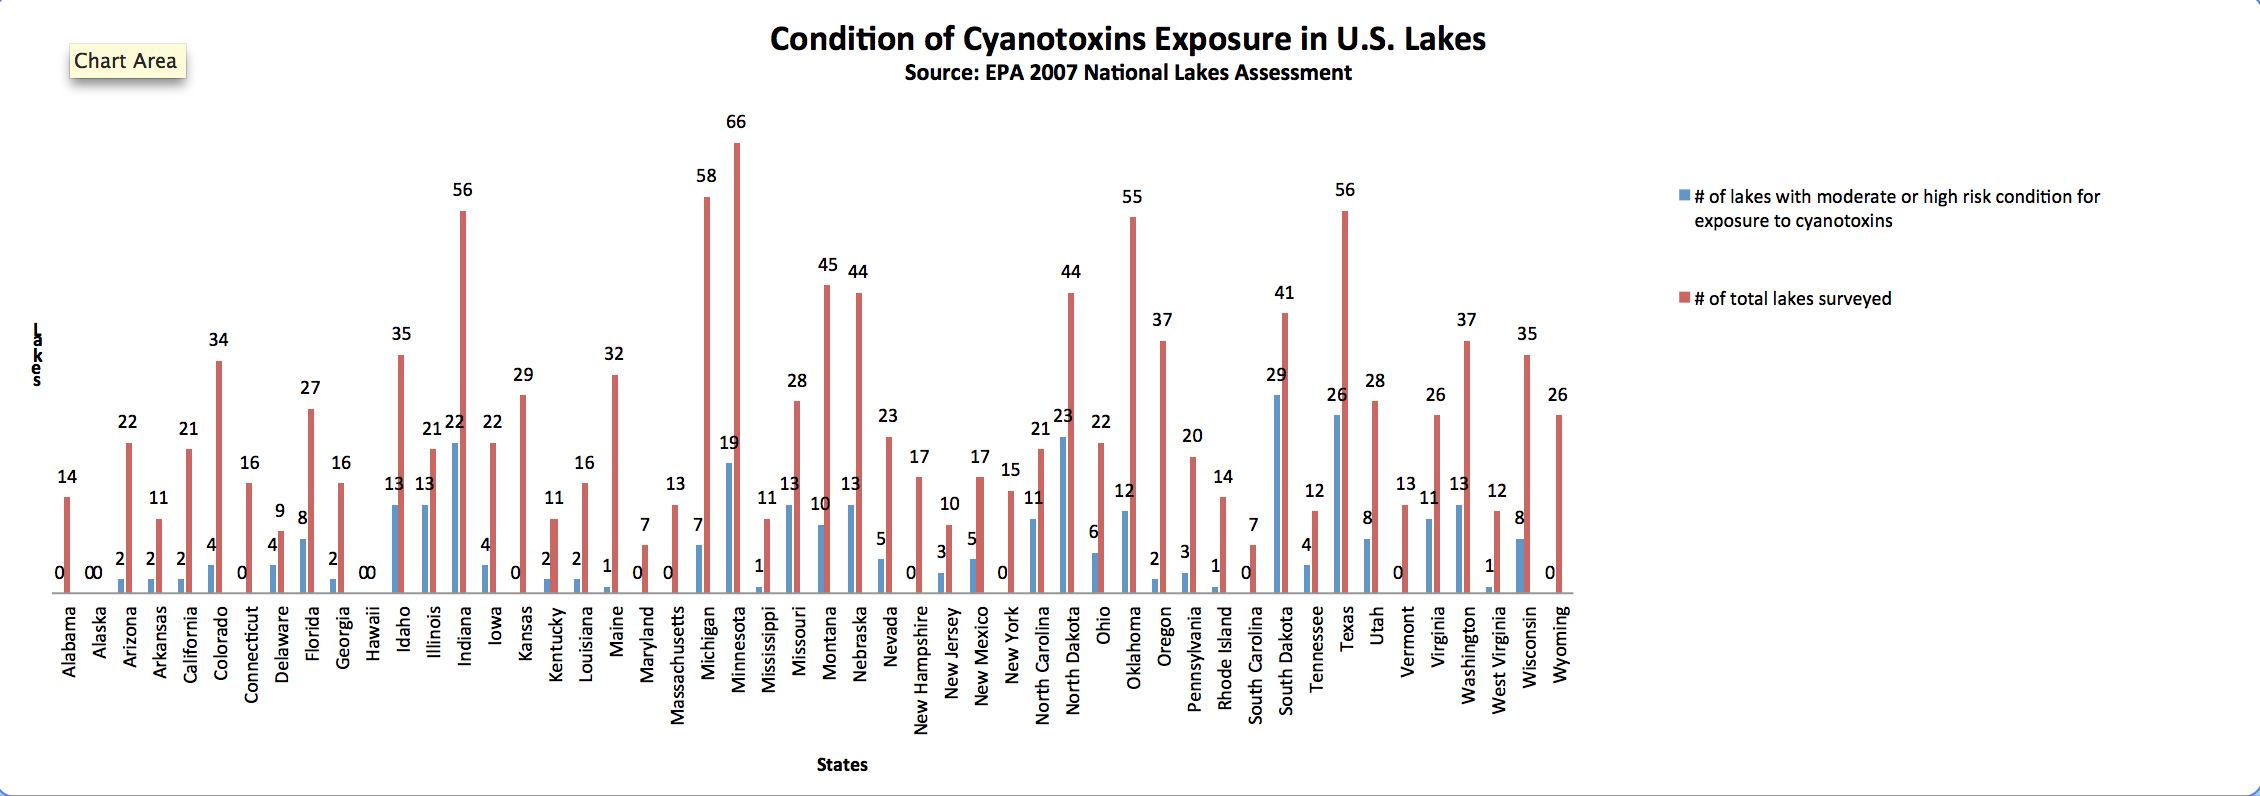
U.S. puts ‘eyes in the sky’ to counter dangerous algae growth
According to the World Health Organization, lakes are considered to have moderate to high health risk if the number of cyanobacteria in the water is equal to or greater than 20,000 cells/mL. The following data shows the number of lakes surveyed by EPA in 2007 and their conditions. Data source: EPA. (Yinmeng Liu/MEDILL NSJI)
BY: YINMENG LIU
WASHINGTON – It is green, slick and is usually clustered in major waterways. It has an adverse effect on human health and could be fatal to fish and dogs. Last year, it contamined the water so badly in Lake Erie that 400,000 people in Toledo, Ohio, were banned from drinking their water for two days.
Blue-green algae, the common name for cyanobacteria, thrives in warm temperatures and flourishes when excessive industrial waste is dumped into rivers. Not all algae is bad, but cyanobacteria produces microcystins, a class of toxins that can cause health problems ranging from skin rashes and body numbness to neurodegenerative diseases and tumors.
“Unfortunately, from Great Lakes to other surfaces of fresh water across the country, algal toxin produced by harmful algal blooms are producing a serious concern to human health and safety,” said Rep. Bob Latta, R-Ohio, during a February speech on the House floor.
Algae bloom is an ongoing problem not just in the U.S., but around the world. TheNational Oceanic and Atmospheric Administration, or NOAA, says almost every U.S. state has been affected by it.
The concern for algal bloom prompted scientists at NOAA to team up with colleagues at the Environmental Protection Agency, United States Geological Survey and National Aeronautics and Space Administration to develop an early warning system. It launchedon April. 7, and is now working to detect the growth of blue-green toxins in major waterways using existing ocean color satellite images.
Blake Schaeffer, a research ecologist at EPA and the principal investigator of the task force, said the interagency effort represents the first time that satellite images are used on a global scale to monitor algae bloom.
“I never saw that being completed and I saw that that is a huge gap and really the under-utilization of a great technology tool,” Schaeffer said. “I thought this would be a great opportunity to see if that was possible.”
Richard Stumpf, who heads NOAA’s ecological forecasting effort and is the project’s head scientist at the agency, said the project was created under the auspices of the Harmful Algae Bloom and Hypoxia Control Act of 2014. The legislation created a working group of federal agencies, led by NOAA, tasked with the goal of submitting to Congress “a comprehensive research plan and action strategy to address marine and freshwater harmful algal blooms and hypoxia.”
Schaeffer said each agency contributes to the project with its expertise. Th Geological Survey, or USGS, helps with logistics on the ground; NASA and NOAA will serve as the basis of satellite intelligence because of their prior experience with the technology; EPA will interpret the satellite images and apply the findings of the project to the development of tools that help protect people and the environment.
“It brings all the partners together under one project,” said Paula Bontempi, the task force’s head scientist at NASA and the leader of the agency’s ocean biology and biogeochemistry research program. “So you’ve got research partners who are able to look at the scientific integrity of the product [that] the operational partners are using, and the operational partners were able to implement the research project for an applied setting.”
A long history of algae bloom regulations
Federal attempts to regulate the algae bloom began as early as the 1960s.
In mid- to late-1960s, large mats of algal bloom were spotted in the western basin of Lake Erie. As a result, United States and Canada signed the 1972 Great Lakes Water Quality Agreement, which called for reducing the levels of phosphorous in waterways.
The lower level of phosphorous concentration temporarily reduced the growth of algae bloom. But it reappeared in the 1990s, and large late-summer algal blooms dominated the waterways of western Lake Erie.
In 1998, concern about algae growth prompted Congress to pass the Harmful Algal Bloom and Hypoxia Research and Control Act. The legislation requested that the president established an interagency task force.
The task force authorized funding and created a national research program under the leadership of NOAA to assess and make recommendations on strategies to control algae. Congress reauthorized the program in 2004 and 2014, and allocated $20.5 million annually through 2018 for NOAA to tackle the algae problem in water bodies.
Congress also passed the Oceans and Human Health Act, creating a national research program to “improve understanding of the role of oceans in human health.” The goals of the program include providing information to prevent marine-related health problems. The program will also build on the work of the interagency task force.
Most recently, Latta, whose constituents have been heavily impacted by the algae bloom, introduced the Great Lakes and Fresh Water Algal Bloom Information Act in September 2014. The bill required NOAA to create an electronic database of researches and actions taken to control algae bloom. The bill was referred to the House Subcommittee on Fisheries, Wildlife, Oceans, and Insular Affairs on Sept. 16, 2014.
Using ocean color technologies to monitor algae
Unlike previous efforts, the current project will put eyes on algae bloom using ocean color satellite sensors, scientists involved said.
“NASA really has led this specific type of expertise initially using satellites to monitor water quality, but more so in global oceans,” said Schaeffer. “We’ve asked them to partner with us to focus more on estuaries and water bodies, such as lakes and reservoirs.”
Agencies use ocean color satellite images to detect the changes of colors in waterways caused by the presence of different materials in the water. Different materials scatter electromagnetic radiation at different wavelengths, causing a rainbow of colors.
Cyanobacteria, for example, will scatter a certain wavelength of light, which enables scientists to detect the amount and presence of the bacteria in water. The use of the ocean color technique in the project will enable the frequent monitoring of a broader area, which is more efficient than water sampling.
Bontempi said there’s a reason that the agencies are only now applying ocean color technologies to monitor algae in a global scale.
“We learn as we go along; we did better at building sensors of satellites, so we may not have the capabilities in the 70s and 80s and 90s to observe what we were able to observe in this century,” Bontempi said.
The first ocean color sensor that NASA launched is the Coastal Zone Color Scanner, which found a place on board the NIMBUS-7 satellite in 1978.
Bontempi said NASA only had two dedicated ocean color satellite platforms in the past. Besides NIMBUS-7, the other sensor is the Sea-viewing Wide Field-of-view sensor developed in 1997.
The ocean color sensors involved in this project are: Medium Resolution Imaging Spectrometer (MERIS) from European Space Agency, Moderate Resolution Imaging Spectroradiometer (MODIS) from NASA and the Ocean Land Colour Instrument (OLCI) from ESA.
Landsat, the longest-running remote sensing technology in the world, is also employed in the project. Now in its eighth installation, the NASA-USGS coordinated satellite program has been fundamental in recording the changes of earth’s surface.
“Landsat has a 30 meters pixel, so it has the potential to give at least some information on smaller lake, few trade-offs are it’s not going to be as specific about the blooms, and also it’s relatively infrequent,” said Stumpf.
“We intend to utilize both Landsat 7 and 8 imagery where possible and will use archived Landsat imagery from previous Landsat missions to generate historical products for cyanoHABs where possible,” wrote Keith Loftin, a research chemist and the project’s lead scientist at USGS, in an email exchange.
Besides the sensors, Schaeffer said he also hopes to employ data from Sentinel 2, Sentinel 3 of the European Space Agency, and Aqua and Terra from NASA.
Shelby Oakley, an assistant director at the Government Accountability Office, said she sees this project as a “positive thing,” because it uses existing satellite data.
“From my perspective, if you are able to use data that you’ve already collected from satellites that you’ve already spent significant amount of money on, the more uses you can have for those data, the better,” said Oakley, “and the more effective and more returns on investment that we can get as a government.”
The base funding of the project, $3.6 million, comes from federal research dollars allocated for a competitive research program at NASA. Bontempi said NASA awarded the budget for this project based on an evaluation of its proposal.
In addition to the $3.6 million, the other three agencies will contribute to any internal costs related to the assignment, Schaffer said.
“We are also providing our personnel resources, people themselves cost money as well to do the work. That’s how each agency is contributing,” said Schaffer. “So if you really tally it up, it will be over $3.6 million.”
A major harmful algae bloom event can divest from local coastal economies tens of millions of dollars. EPA stated in a report from 2012 that the Toledo government spends up to $200,000 a month on carbon to rein in the spread of algae bloom.
A major program in NASA is defined as $250 million or more, Oakley said.
“I think if you are talking about risks, it’s certainly not going to be a financial risk that you are looking at,” she said regarding the project.
The project is awarded for five years. In addition to the satellite monitoring, scientists are also developing a mobile application and a website which will warn the public to avoid water bodies with high concentration of algae.
“To me, that’s kind of the big-picture goal with this,” Schaeffer said. “How do we really begin to deliver these water-quality satellite images in a way that people don’t have to worry so much on the technical side of things and they can use the information to make decisions going forward.”
Though the project was just launched in April, scientists have high hopes for the project’s development going forward.
“This is one of the first projects I can recall where all these federal agencies came together in such a way,” Bontempi said, “because of having all of these research and operational federal partners on board, the team has a real shot at achieving their objectives.”
“I don’t expect at the end of five years we just cut our ties and walk away, I think this will spur a lot of discussions about how do things like this become fully-operational and commonplace in the future,” said Schaeffer.
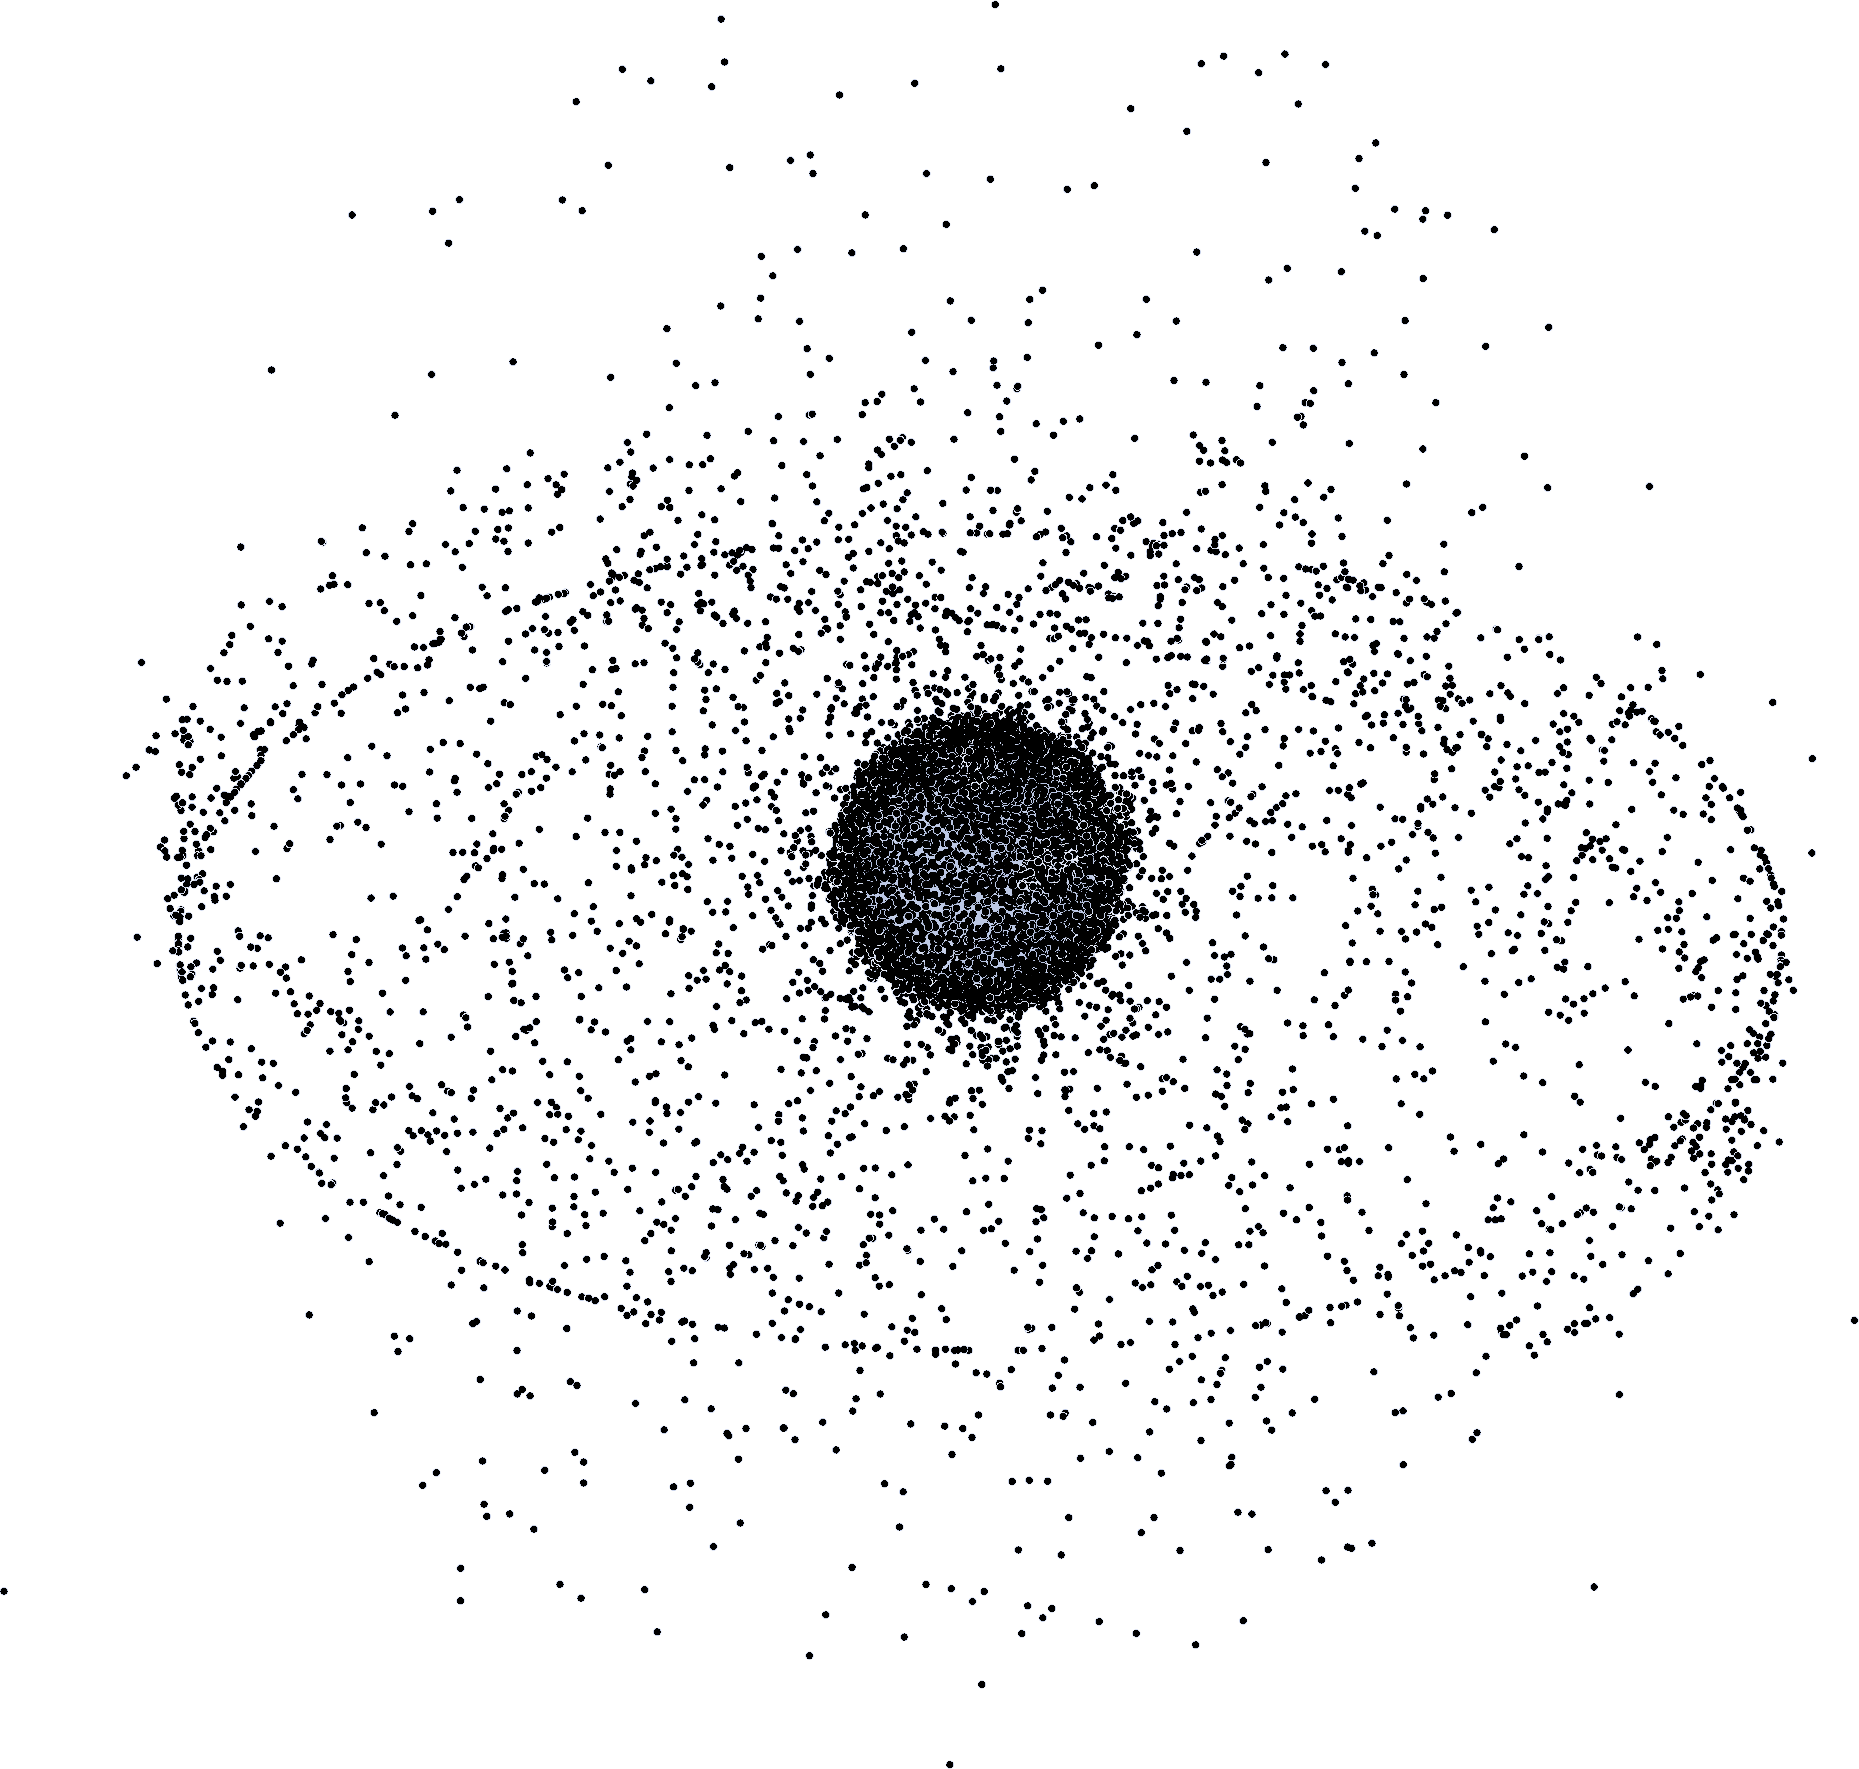
NASA illustration courtesy Orbital Debris Program Office.
WASHINGTON — To call space debris an expensive nuisance would be a huge understatement.
With a typical impact speed of 10 km/second orbital debris, the man-made space junk that orbits the planet poses a deadly threat to human space flight and the safety of satellites.
Over the decades, orbital debris has accumulated in the various levels of Earth’s orbit. The Air Force has catalogued and tracked about 23,000 objects that are four inches or larger. According to Dr. J.- C. Liou, the chief scientist at NASA’s Orbital Debris Program Office (managed by Safety Mission Assurance), the estimate for objects around 1 millimeter or larger is of the order of 100 million.
It only takes a piece as small as 0.3 millimeters to hamper space flight and even take out a multi-million dollar satellite.
The ODPO is based at NASA’s historic Johnson Space Center in Houston and monitors the orbital debris environment and develops the mitigation measures to protect the users of it.
Space’s domain differs greatly from anything in our atmosphere. Once a satellite is put into orbit, it is there indefinitely. It can’t be repaired and there are no territorial boundaries.
So the only hindrance for a nation or private firm to put up a satellite is the level of its technology to do it.
As satellites approach the end of their life span, they are either moved into higher orbit with the last of their fuel supply or left to slowly reenter the Earth’s atmosphere where they degrade enough to fall back to the earth safely.
Any remediation measures that are practical have not been implemented yet. Todd Harrison, a Center for Strategic and Budgetary Assessments senior fellow in defense budget studies, said that any way to try and collect the orbital debris would be highly problematic because of the sheer volume and spread of the debris and the vast size of the space in question.
Even if it were feasible, the issue of basic accountability arises because it is difficult to trace where most of the debris originated.
Protecting satellites is possible but comes at great cost because the extra mass in shielding increases the expense of launching the satellite into orbit.
“Mass is precious on satellites, so there is a huge cost to adding shielding,” Harrison said.
So national space programs and commercial satellite owners generally have two viable options to deal with the orbital debris issue: Limit the creation of more debris and stay out of the way of what’s already up there.
The ODPO’s mitigation policy seeks to carefully control the amount of orbital debris that is added to Earth’s orbit so that it grows at a manageable rate.
Low Earth orbit is the space between the altitude of 160 kilometers and 1,930 kilometers. All space stations and the majority of satellites, particularly imaging satellites, orbit in LEO. Of the roughly more than 6,000 metric tons of material whichwhich orbits the Earth, around 2,700 tons of material is in low Earth orbit.
A significant amount of this mass came from only two major collisions within the past 10 years; one intentional and one accidental.
On Jan. 11, 2007, China tested an anti-satellite missile by firing it at one of its old weather satellites. The resulting explosion produced more than 3,000 pieces of trackable debris particles and as much as 150,000 particles in total, the largest recorded creation of space debris.
Two years later, the first ever accidental collision occurred between two intact satellites in low Earth orbit. On Feb. 10, the Iridium 33 commercial satellite and the out of service Russian Kosmos 2251 military communications satellite collided at a speed of 42,120 km/hour. Both satellites were completely destroyed and over 2,000 large pieces of debris were catalogued by the U.S. Space Surveillance Network by July 2011.
These two events are responsible for doubling the amount of orbital debris in low earth orbit.
The largest threat that orbital debris poses is through what is called the Kessler syndrome. The increasing population of orbital debris increases the likelihood that they will collide and further increases the likelihood of cascading collisions after an initial impact.
The eventual worst-case outcome of this is that low Earth orbit is rendered unusable for future generations. This scenario was portrayed, albeit much more rapidly, in the 2013 popular science fiction film “Gravity.”
The U.S. government responded to this bleak outcome by creating the Orbital Debris Mitigation Standard Practices in 1997. These guidelines limit the generation of orbital debris across the U.S. NASA, the ODPO, DOD, FCC, and FAA have all developed and follow similar measures.
On May 21 Congress passed H.R 2262, the Spurring Private Aerospace Competitiveness and Entrepreneurship (SPACE) Act.
As part of the SPACE Act, Congress called for an immediate to address orbital traffic management. Among the parameters called for in the study is the review of the requirements set forth under any treaties and international agreements which the U.S. is a part of and how the Federal government complies with each.
“We are doing a reasonable job to implement the standard practices, trying to limit the generation of orbital debris,” Liou said “But of course nothing is perfect, there’s room for improvement.”
Safety Mission Assurance, which controls the Orbital Debris Program Office, has received an average of $48.1 million of NASA’s budget for safety oversight between 2011 and 2014.
“”That’s enough to think about the problem but not to actually do anything.”” Harrison said.
The estimated amount for 2015 is $48.7 million, with a request for $50.1 million in 2016. Along with the ODPO, Safety Mission Assurance also manages the Electronic Parts and Packaging Program and the Safety Center, among other operations.
NASA’s figures for Safety Mission Assurance in future years project a steady rise up to $53.2 million in 2018.
On an international scale, the standards for debris management are set by the Inter-Agency Space Debris Coordination Committee (IADC), which consists of the 13 major international space agencies. The committee’s own set of orbital debris mitigation guidelines were developed in 2002 and include avoiding intentional destruction or harmful activity in space. The United Nation developed its own guidelines in 2007.
While monitoring and mitigation have gone a long way toward managing the problem, the risk of accidental collisions remains high. The consensus from a major monitoring study by the IADC expects one major accidental collision every five to 10 years for the next 20 to 30 years.
“It’s something that we expect to get worse and it’s something that we need to do a better job to control the growth of… but the sky is not really falling today,” said Liou.
Currently the biggest problem for mitigation is that the pieces that are too small to track but large enough to do significant damage.
“There’s a gap in there of stuff that is too large for shielding but too small to track and you’re just taking a risk,” Harrison said.
On June 2, 2014, it was announced that Lockheed Martin landed the $914 billion contract to build Space Fence, which would replace the Air Force Space Surveillance System as the next-generation safety net.
“When it comes online in 2018, Space Fence will enable the Air Force to locate and track hundreds of thousands of objects orbiting Earth with more precision than ever before to help reduce the potential for collisions with our critical space-based infrastructure,” said Steve Bruce, vice president for advanced systems at Lockheed Martin’s mission systems and training business.
The radar system will be based on the Pacific Island of Kwajalein Atoll. The Air Force has spent some $1.6 billion to date on the the Space Fence program, according to a March 2014 Government Accountability Office report.
The Voice of America featured NSJI in a recent article about how it prepares journalists to cover stories in conflict zones.
McCormick Foundation renews grant for Medill National Security Journalism program
EVANSTON, Ill. — The Robert R. McCormick Foundation has renewed a $1 million grant to fund the Medill National Security Journalism Initiative at Northwestern University over the next two years.
The NSJ program provides journalists-in-training and working journalists with the knowledge and skills necessary to report accurately, completely and with context on events and issues related to defense, security and civil liberties. The initiative began in January, 2009 with an initial three-year, $1.3 million McCormick Foundation grant. The grant was also renewed for $1 million over two years in 2011.